This is one of my “shelf” projects that I want to make . I use a Arduino Nano to connect all the sensors to. Arduino is a very inexpensive platform and comes in different sizes and configuration you can choose it as per your need. I did this project as a side project as I wanted to measure how clean the air in the house is and how it changes over time.

In the news the speak more and more about the major issue of Micro dust particles in the air. These micro dust particles are also responsible for respiratory and Skin allergies. You can see the final display as below. It covers Temperature, Humidity, Time and Dust content level.
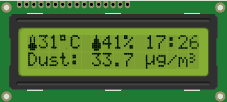
A Arduino does not keep the time to do this I have connected a RTC module which can persist the time information even when the device is switched off. Real time sensor data is displayed on the LCD screen and is also logged to a file in the SD card so that it can be analysed later. For debugging purpose I am also writing the data to the serial port so that I can monitor it from my Mac.
In my initial design I was using the 16X2 LCD without the serial I2C module this was giving problem as it did not leave enough free I/O pins to connect other stuff on the Arduino. By switching to I2C module I am not loosing a single pin on Arduino as SDA and SLC pins used by I2C module is shared with RTC Clock. To minimize the noise in the reading I have taken an average of 1000 readings.
The Hardware
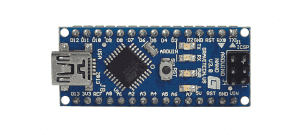
Arduino Nano V3.0
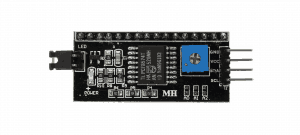
IIC/I2C/TWI/SPI Serial Interface Module for LCD
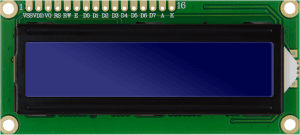
Blue LCD 16 characters 2 Lines
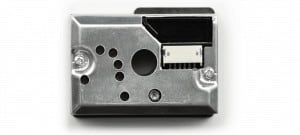
Sharp Optical Dust Sensor (GP2Y1010AU0F)
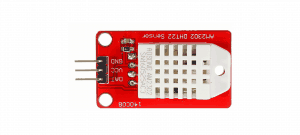
DHT22 Temperature & Humidity Sensor
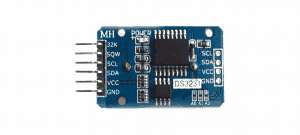
DS3231, extremely accurate I2C real-time clock (RTC)
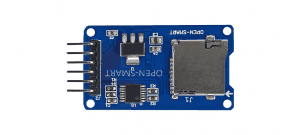
SD Card Reader/Writer Module
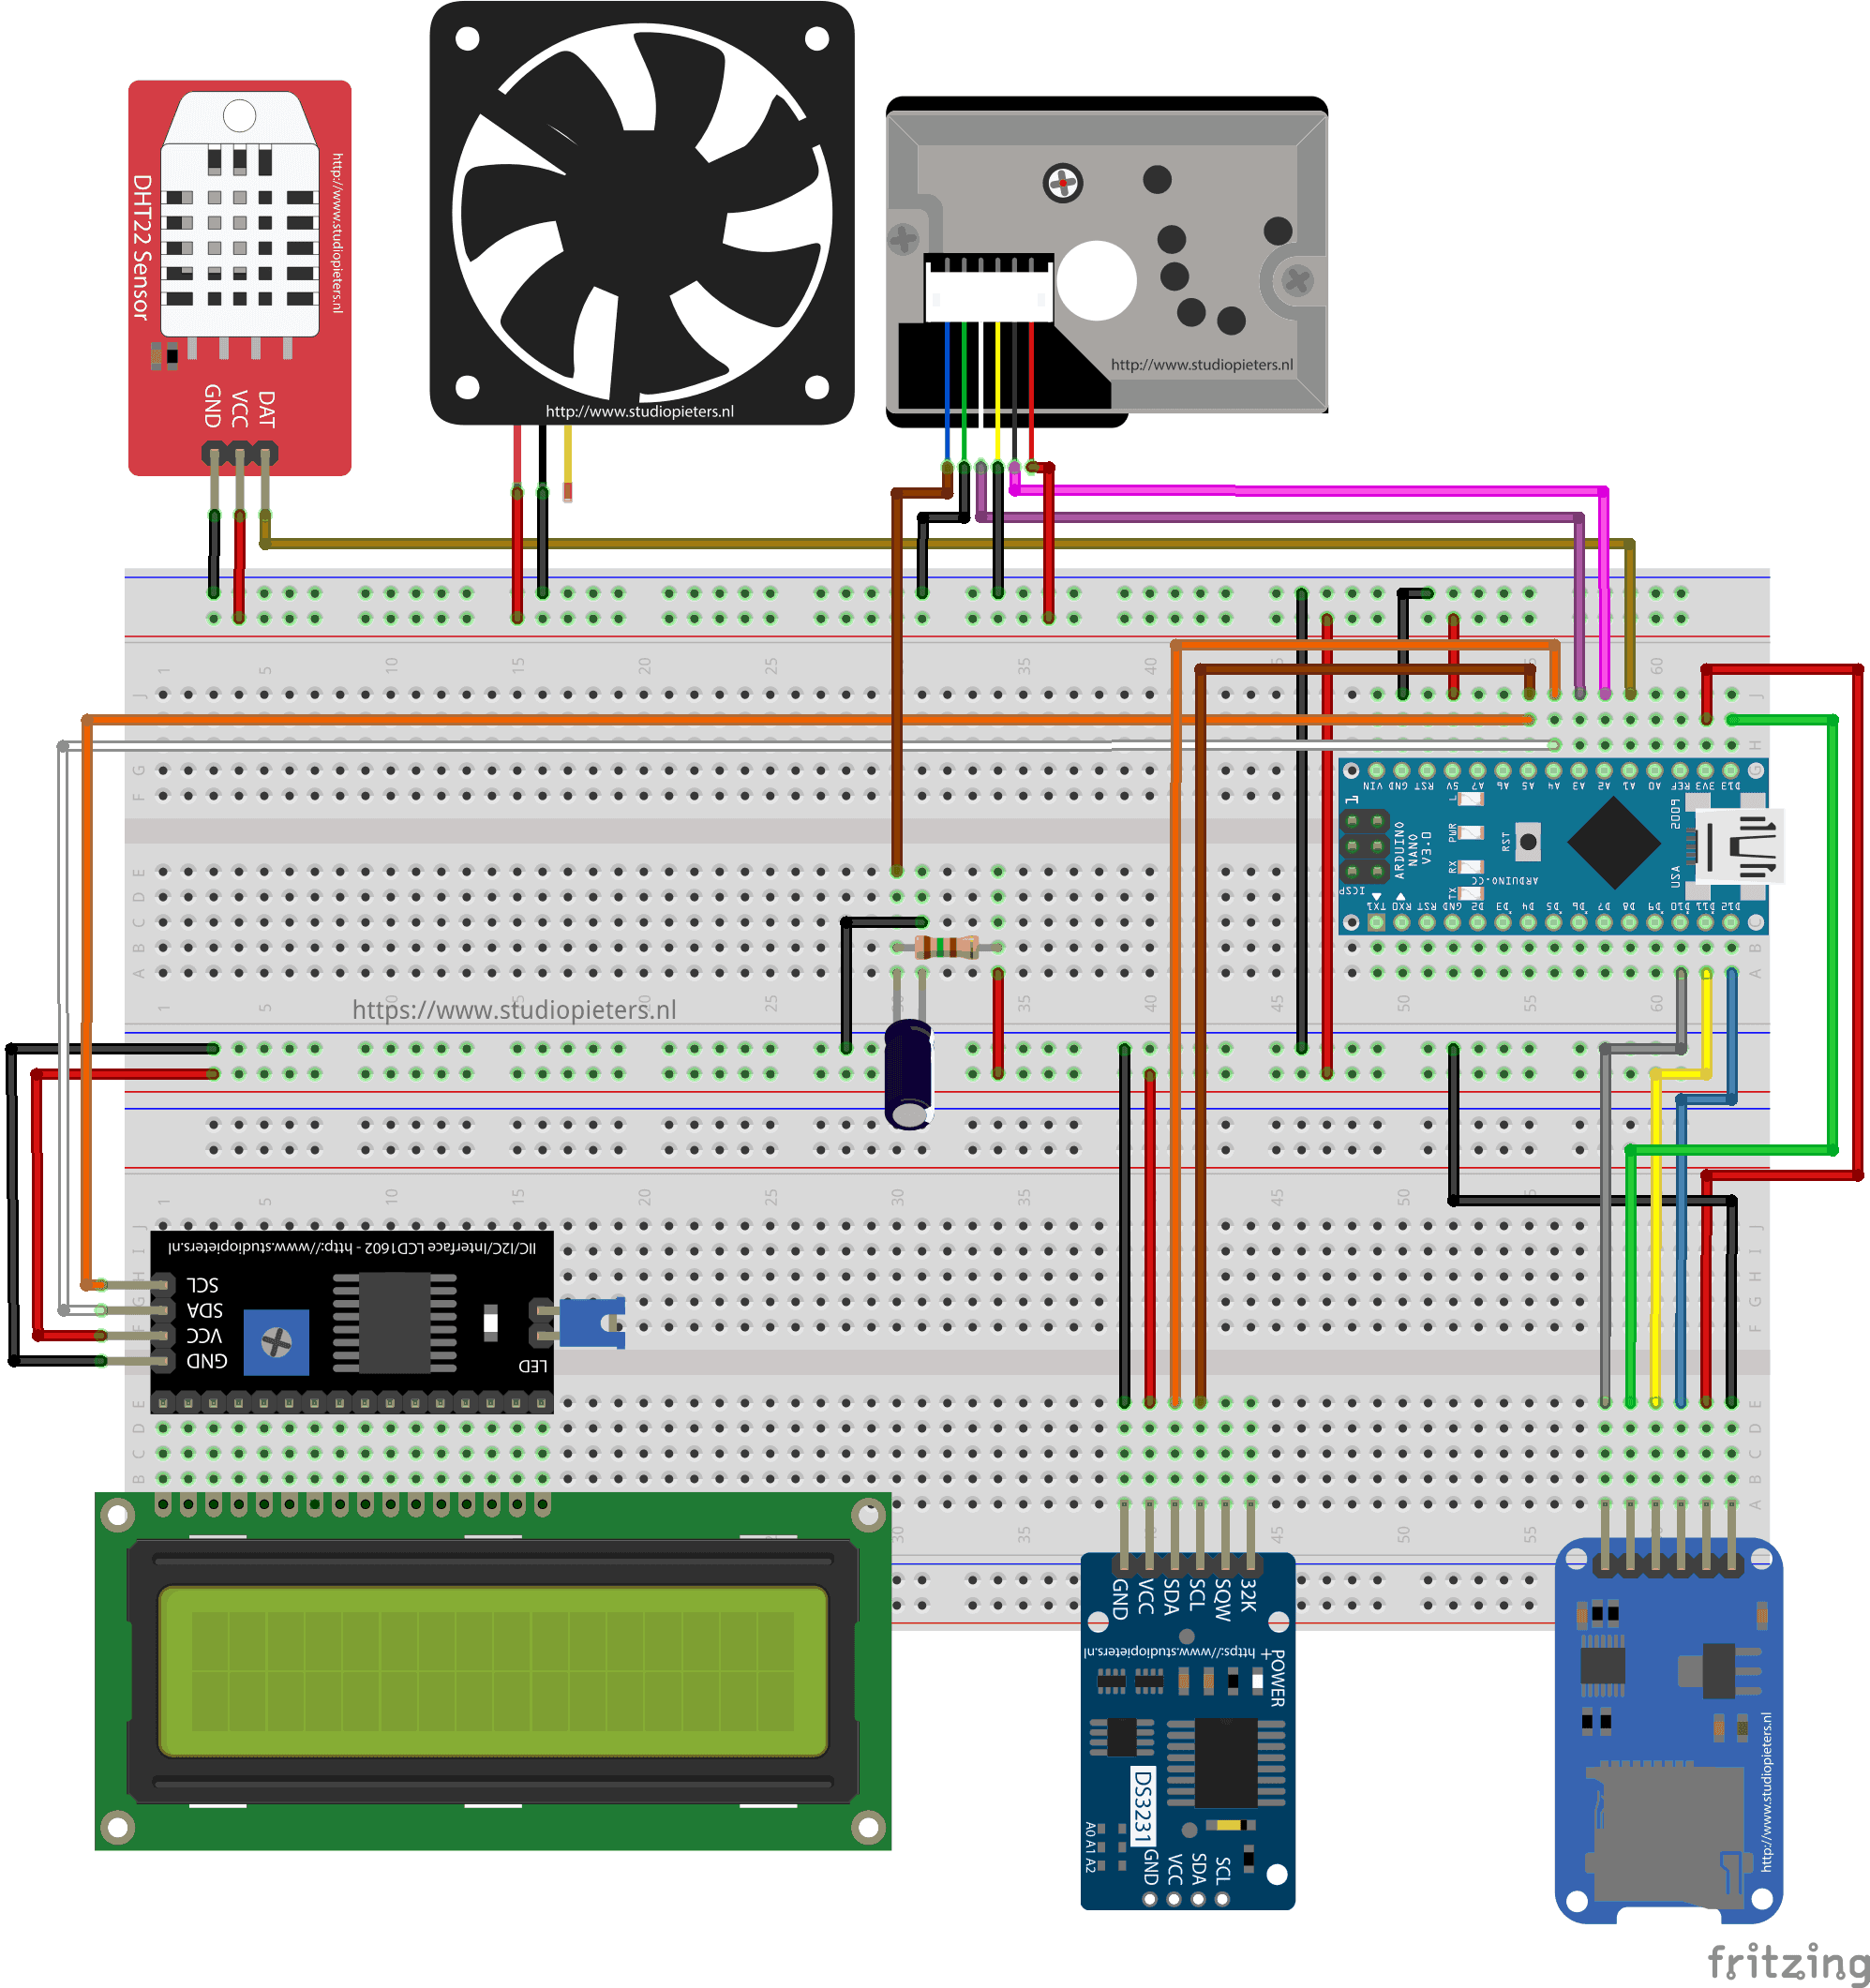
The circuit
You can see the full circuit as below This is my first attempt to design a circuit diagram, Have used Fritzing which is a open source designer for this purpose.
Graph
The log data is written to datalog.txt file on the SD Card. Each line in the file corresponds to a log entry. log entry are separated by a comma CSV. you can created a small graph in for example Numbers (Mac) Excel (Windows & Mac). You will be surprised to see the results even in the graph below you can see the variation in the Dust levels.
The Code
/* Project name: Arduino - Air Quality Monitor
   Project URI: https://www.studiopieters.nl/arduino-air-quality-monitor
   Description: Arduino - Air Quality Monitor
   Version: 3.1.0
   License: MIT
*/

#include <LiquidCrystal_I2C.h>
#include <DHT.h>
#include <Wire.h>
#include "RTClib.h"
#include <SPI.h>
#include <SD.h>

#define DHTTYPE DHT11

// select the pins used on the LCD panel
LiquidCrystal_I2C lcd(0x27, 2, 1, 0, 4, 5, 6, 7);

DHT dht(A1, DHTTYPE);
const int chipSelect = 4;
int measurePin = A2;
int ledPower = A3;
int thermistorPin = A1;

int samplingTime = 280;
int deltaTime = 40;
int sleepTime = 9680;

float voMeasured = 0;
float calcVoltage = 0;
float dustDensity = 0;

float avgDust = 0;
int avgDustCnt = 0;

byte termometru[8] = //icon for termometer
{
  4, 10, 10, 10, 14, 31, 31, 14
};

byte picatura[8] = //icon for water droplet
{
  4, 4, 14, 14, 31, 31, 31, 14
};

byte threeIco[8] = //raise to power 3 character
{
  24, 4, 24, 4, 24, 0, 0, 0
};

byte miliIco[8] = //micrograms character
{
  0, 17, 17, 17, 19, 29, 16, 16
};


boolean backlit = true;
RTC_DS1307 rtc;

void setup()
{
  lcd.begin (16, 2); // for 16 x 2 LCD module
  lcd.createChar(1, termometru);
  lcd.createChar(2, picatura);
  lcd.createChar(3, threeIco);
  lcd.createChar(4, miliIco);
  lcd.setBacklightPin(3, POSITIVE);
  lcd.setBacklight(HIGH);
  Serial.begin(9600);
  while (!Serial) {
    ; // wait for serial port to connect.
  }
  Wire.begin();
  rtc.begin();
  //Uncomment this line and upload the sketch to arduino after uploading
  //again comment it and upload the sketch again this will set the date and time
  //rtc.adjust(DateTime(F(__DATE__), F(__TIME__)));
  pinMode(A3, OUTPUT);
  lcd.home();
  if (!SD.begin(chipSelect)) {
    Serial.println("Card failed, or not present");
    lcd.print("Card failed, or not present");
    // don't do anything more:
    return;
  }
  Serial.println("card initialized.");
  lcd.print("Card Initialized");
}

void loop()
{
  DateTime now = rtc.now();
  digitalWrite(ledPower, LOW); // power on the dust sensor LED
  delayMicroseconds(samplingTime);

  voMeasured = analogRead(measurePin); // read the dust value

  delayMicroseconds(deltaTime);
  digitalWrite(ledPower, HIGH); // turn the dust sensor LED off
  delayMicroseconds(sleepTime);

  // 0 - 5V mapped to 0 - 1023 integer values
  // recover voltage
  calcVoltage = voMeasured * (5.0 / 1024.0);
  dustDensity = (0.17 * calcVoltage - 0.1) * 1000;

  avgDust += dustDensity;
  avgDustCnt++;
  if (avgDustCnt == 1000)
  {
    // make a string for assembling the data to log:
    String dataString = "";
    dataString += "Dst" + String(avgDust / avgDustCnt) + ",";
    dataString += "Tmp" + String(dht.readTemperature()) + ",";
    dataString += "Hum" + String(dht.readHumidity()) + ",";
    dataString += String(now.year()) + "/" + String(now.month()) + "/" + String(now.day()) + " ";
    dataString += String(now.hour()) + ":" + String(now.minute()) + ":" + String(now.second());
    File dataFile = SD.open("airlog.txt", FILE_WRITE);
    lcd.clear();
    lcd.home();
    lcd.write(1);
    lcd.print(dht.readTemperature(), 0);
    lcd.print((char)223);
    lcd.print("C ");
    lcd.write(2);
    lcd.print(dht.readHumidity(), 0);
    lcd.print("%");
    lcd.print(" ");
    if (now.hour() < 10)
    {
      lcd.print('0');
    }
    lcd.print(now.hour(), DEC);
    lcd.print(':');
    lcd.print(now.minute());
    lcd.setCursor(0, 1);
    lcd.print("Dust: ");
    lcd.print(avgDust / avgDustCnt, 1);
    lcd.print(" ");
    lcd.write(4);
    lcd.print("g/m");
    lcd.write(3);
    // if the file is available, write to it:
    if (dataFile) {
      dataFile.println(dataString);
      dataFile.close();
      // print to the serial port too:
      Serial.println(dataString);
    } else {
      Serial.println("error opening datalog.txt");
    }
    avgDust = 0;
    avgDustCnt = 0;
  }
}
How to Read PM2.5 Readings
Due to the many adverse effects fine particles can inflict on a large number of people, PM2.5 is one of the major pollutants closely monitored by health authorities around the world. You will most likely come across a dedicated column for PM2.5 alongside the Air Quality Index (AQI), Pollutants Standards Index (PSI) or the air quality standards adopted by your country.
On a very clear and non-hazy day, the PM2.5 concentration can be as low as 5 μg/m3 or below. The 24-hour concentration of PM2.5 is considered unhealthy when it rises above 35.4 μg/m3.
Why 24-hour and not a shorter duration when evaluating the health impact of fine particles? This is because the potential damage caused by air pollutants depends not just on the concentration, but also on the duration of exposure. The longer you are exposed to PM2.5, the higher the risk of developing adverse effects caused by the exposure. That’s why a 24-hour measurement is a better reflection of the health effects of fine particles than say a three-hour reading.
The table below will give you a sense of what levels of PM2.5 are harmful and the appropriate precautions you need to take. It is based on the air quality standards for particle pollution published by the U.S. Environmental Protection Agency.
24-Hour PM2.5 Standard (μg/m3)
PM2.5 |
Air Quality Index |
PM2.5 Health Effects |
Precautionary Actions |
| 0 – 12.0 | Good ( 0 – 50 ) |
Little to no risk. | None. |
| 12.1 – 35.4 |
Moderate
(51 – 100) |
Unusually sensitive individuals may experience respiratory symptoms. | Unusually sensitive people should consider reducing prolonged or heavy exertion. |
| 35.5 – 55.4 |
Unhealthy for Sensitive Groups
(101 – 150) |
Increasing likelihood of respiratory symptoms in sensitive individuals, aggravation of heart or lung disease and premature mortality in persons with cardiopulmonary disease and the elderly. | People with respiratory or heart disease, the elderly and children should limit prolonged exertion. |
| 55.5 – 150.4 |
Unhealthy
(151 – 200) |
Increased aggravation of heart or lung disease and premature mortality in persons with cardiopulmonary disease and the elderly; increased respiratory effects in general population. | People with respiratory or heart disease, the elderly and children should avoid prolonged exertion; everyone else should limit prolonged exertion. |
| 150.5 – 250.4 |
Very Unhealthy
(201 – 300) |
Significant aggravation of heart or lung disease and premature mortality in persons with cardiopulmonary disease and the elderly; significant increase in respiratory effects in general population. | People with respiratory or heart disease, the elderly and children should avoid any outdoor activity; everyone else should avoid prolonged exertion. |
| 250.5 – 500.4 |
Hazardous
(301 – 500) |
Serious aggravation of heart or lung disease and premature mortality in persons with cardiopulmonary disease and the elderly; serious risk of respiratory effects in general population. | Everyone should avoid any outdoor exertion; people with respiratory or heart disease, the elderly and children should remain indoors. |
DOWNLOAD ALL FILES FOR THIS PROJECT ON GITHUB.

DO YOU HAVE ANY QUESTIONS? LEAVE A COMMENT DOWN HERE.
REFERENCES
DoTheDiy. Air quality monitor. (7 Juli 2015) http://www.dothediy.com/2015/07/air-quality-monitor.html Chris Nafis. Air quality monitoring (1 Jan 2012) http://www.howmuchsnow.com/arduino/airquality/