
Electronics
Arduino Air Quality Monitor with a Dust Sensor and SD Card Log
An Arduino Nano with a Sharp dust sensor, a DHT22, a clock and an SD card that logs the air quality at home.
- Arduino
- Archived
- 3 min read
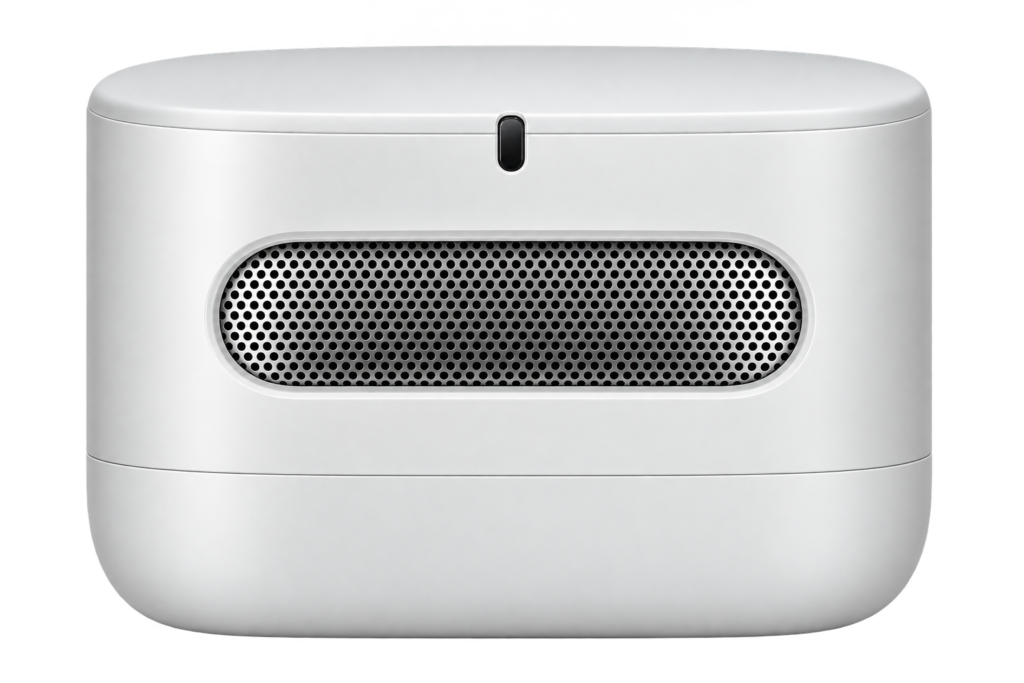
Archived project
The GitHub repository for this project is archived: it is read-only and no longer updated. What follows describes the project as it was, so check for a newer alternative before you build it.
An air quality monitor for at home, built on an Arduino Nano. It measures dust with an optical sensor, and temperature and humidity with a DHT22, shows the values on a small display and writes them with the time to an SD card, so you can look at the air in your home over days.
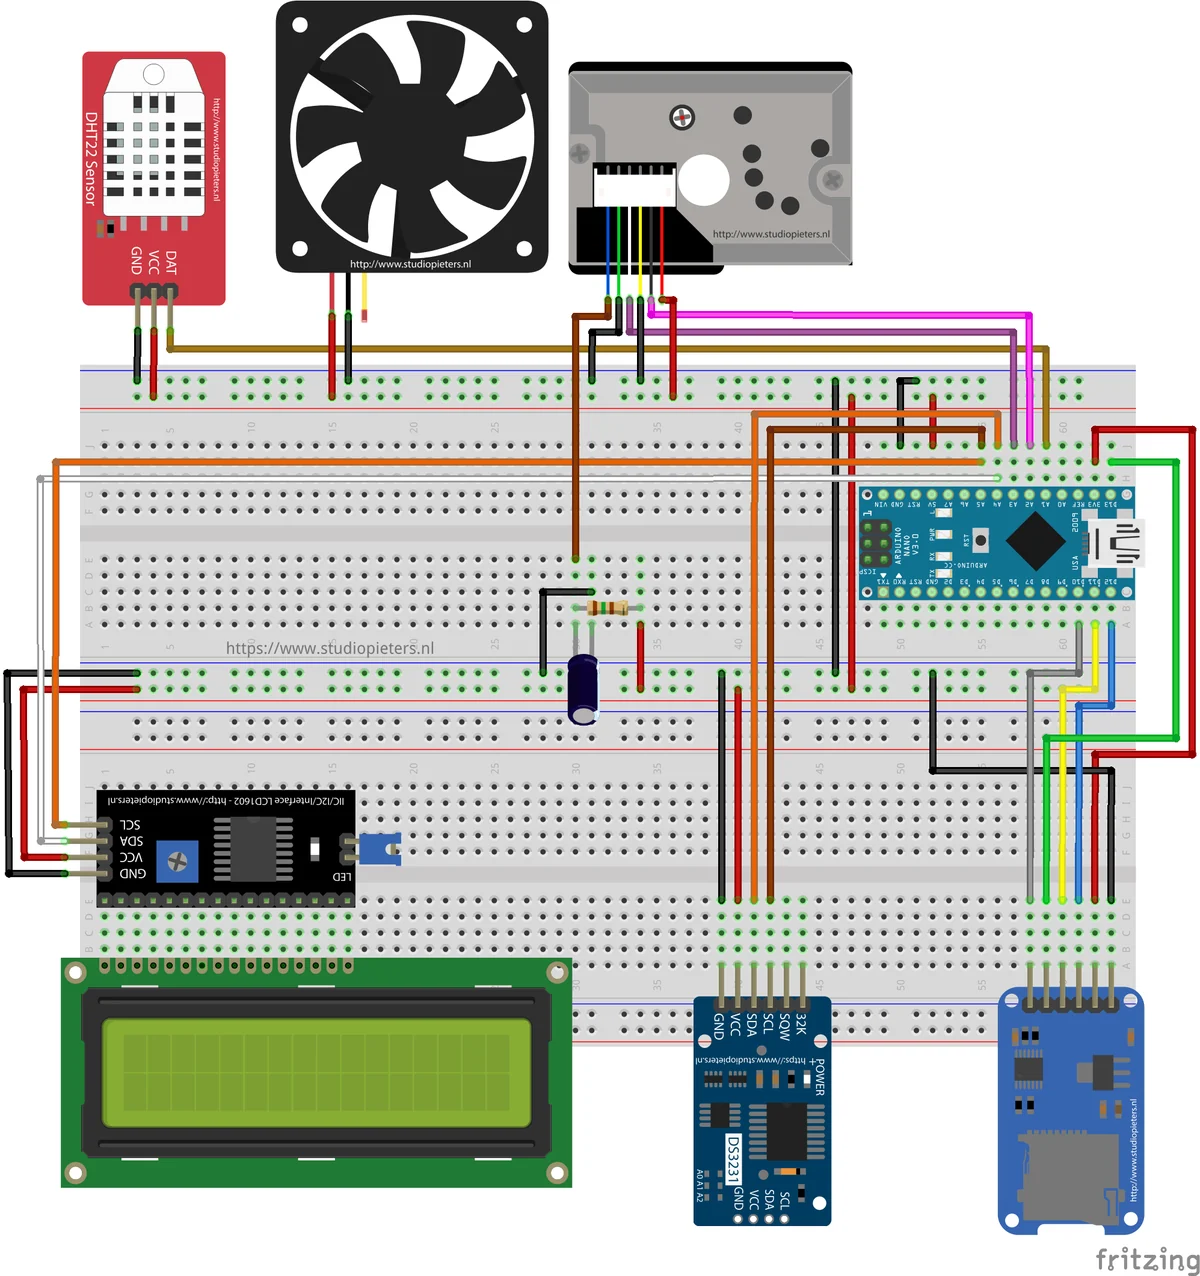
The parts
| Part | What it does |
|---|---|
| Arduino Nano | The controller |
| GP2Y1010AU0F dust sensor | Measures the amount of dust in the air, with an infrared LED and a light sensor |
| Fan | Blows air through the dust sensor |
| DHT22 | Temperature and humidity |
| DS3231 real-time clock | Keeps the time, also without power from the Arduino |
| 16 by 2 LCD with an I2C adapter | Shows the values, at address 0x27 |
| SD card module | Stores a log file |
| Resistor and capacitor | Next to the dust sensor, as in the recommended circuit of its datasheet for the LED |
See the Arduino Nano pinout for the pins of the board.
The dust sensor
The Sharp GP2Y1010AU0F sits in a small case with a hole for the air. An infrared LED lights the air inside, a light sensor picks up what dust particles reflect, and the output voltage tells how much dust there is. The datasheet gives these numbers (at 5 V and 25 °C):
| Property | Value |
|---|---|
| Supply | 5 V, ±0.5 V |
| Sensitivity | 0.5 V for every 0.1 mg/m³, with 0.35 to 0.65 as the range |
| Output with no dust | 0.9 V typical, up to 1.5 V |
| Current | 11 mA typical, 20 mA at most |
| LED pulse | Every 10 ms, 0.32 ms wide |
| Recommended LED circuit | A 150 Ω resistor and a 220 µF capacitor |
| Operating temperature | -10 to +65 °C |
The LED has to be pulsed, and the output is read at the end of the pulse. The sketch follows that timing: the LED is switched on, it waits 280 µs, reads the output, waits 40 µs and switches the LED off, and then it waits 9680 µs, which makes a cycle of 10 ms.
The datasheet has a few warnings for a home build. Dust that sticks inside the hole affects the reading, so blow the sensor clean with air from time to time and do not wash it. Keep light from outside away from the hole. The sensor is not meant for a fire alarm.
That is what the fan is for: it moves air through the sensor, so it does not have to wait for the air to drift in on its own.
What the sketch does
The sketch is version 3.1.0. It needs these libraries: LiquidCrystal_I2C, DHT, RTClib and the standard SPI, Wire and SD libraries.
- Every 10 ms it takes one dust reading and turns it into a voltage.
- It converts the voltage to a dust density in µg/m³ with a linear equation from Chris Nafis (howmuchsnow.com),
(0.172 × voltage − 0.0999) × 1000. - After 1000 readings, which is about 10 seconds, it takes the average.
- It then shows the temperature, the humidity, the time and the average dust density on the display, and writes a line with the same values and the date to
datalog.txton the SD card and to the serial monitor.
A line in the log looks like this, for example: Dst12.3,Tmp21.5,Hum48.0,2018/6/4 12:0:0, with the dust density first, then the temperature, the humidity and the date and time. The clock is set to the compile time if it has lost its power.
Things to check
- The reference voltage. The sketch converts the reading with
3.3 / 1024, which assumes a 3.3 V reference for the analog input. A Nano uses 5 V by default, unless the AREF pin is connected to 3.3 V. Check this on your build, or the dust value will be off. - The fan is not controlled. It runs on the supply and the sketch does not switch it.
- Not a calibrated instrument. The equation is an approximation. Use the values to compare one moment with another, for example while cooking or with a window open, and not as an exact measurement.
Good to know
- The repository holds the sketch and the diagram, and is under the MIT licence.
The project is in the Arduino—Air-Quality-Monitor repository on GitHub.
Related
 Opinion
Why You (Should or Shouldn’t) Buy a Smart Plug from Action
Budget smart plugs from Action and HEMA are cheap because they're all the same Tuya white-label hardware behind the scenes, and that convenience comes with your data routing through Tuya's servers. Here's what's actually inside one, and why reflashing it with your own firmware is the better deal.
Read more
Opinion
Why You (Should or Shouldn’t) Buy a Smart Plug from Action
Budget smart plugs from Action and HEMA are cheap because they're all the same Tuya white-label hardware behind the scenes, and that convenience comes with your data routing through Tuya's servers. Here's what's actually inside one, and why reflashing it with your own firmware is the better deal.
Read more
 Software
ESP32 WS2811 LED Strip Driver
A driver for WS2811 RGBIC LED strips on the ESP32, using the RMT peripheral to drive a strip from one data line.
Read more
Software
ESP32 WS2811 LED Strip Driver
A driver for WS2811 RGBIC LED strips on the ESP32, using the RMT peripheral to drive a strip from one data line.
Read more
 Software
Homebridge Plugin for an HTTP Switch
A Homebridge plugin that calls a web address to switch a device on and off, and shows it as a switch in the Home app.
Read more
Software
Homebridge Plugin for an HTTP Switch
A Homebridge plugin that calls a web address to switch a device on and off, and shows it as a switch in the Home app.
Read more
More projects
Keep building.
Electronics, 3D printing and CNC builds, documented from the first idea to the last screw.
All projects